Since the number of cryptocurrencies is growing exponentially, traders are continuously searching for new tools and indicators to identify the crypto market patterns. Bitcoin as the largest cryptocurrency by market capitalization has higher trading volume on the entire crypto market. This higher trading volume and attention from traders and investors create a new tool to analyze and predict the crypto market, This tool is known as the Bitcoin Dominance.
Introduction
The concept of crypto dominance is an important aspect on the cryptocurrency market. Simply put, crypto dominance refers to the percentage of a particular cryptocurrency held in the overall cryptocurrency market capitalization. For example, Bitcoin as the largest cryptocurrency holds more than 40% of the entire crypto market capitalization. This is the reason for Bitcoin to regularly lead in dominance metrics and become the first-mover of the entire crypto market.
By far, Bitcoin was the biggest cryptocurrency for many years and may be the only cryptocurrency recognizable by most people. Bitcoin dominance was above 90% and much closer to 100% compared to nowadays. However, along with the birth of many other crypto projects which gained popularity since 2018, became the reason why Bitcoin’s market dominance is dwindling.
To calculate a crypto dominance, we calculate from its market cap first. To calculate crypto market cap, we can use this formula:
| Crypto market cap = Crypto price X Its circulating supply |
After that we divide the market cap result with the entire crypto market capitalisation, as follows:
| Crypto dominance = Crypto market cap ÷ Total crypto market cap X 100 |
We will make example of how to calculate crypto dominance by calculating current Bitcoin dominance, as explained below
Bitcoin Dominance
In simple terms, Bitcoin dominance is the ratio between the market capitalization (market cap) of Bitcoin to the market cap of the entire cryptocurrency market. In more detail, Bitcoin dominance is a percentage value that is calculated based on Bitcoin’s current market capitalisation divided by the global crypto market cap’s value. The result of this calculation is known as Bitcoin dominance or Bitcoin index.
To calculate Bitcoin dominance by its market cap, we use this formula:
| Bitcoin market cap = Bitcoin price X Circulating supply |
Bitcoin market cap = 26,000 USD (as of June 2023) X 19,402,850 BTC (as of June 2023)
= 504,474,100,000 USD
To calculate its dominance over the crypto market we use this formula
| Bitcoin dominance = Bitcoin market cap ÷ Total crypto market cap X 100 |
= 504,474,100,000 USD ÷ 1,021,000,000,000 (as of June 2023) X 100
= 49,4
In this calculation we know that Bitcoin dominance ratio over the entire crypto market cap is around 49,4% dominance. Which means, the other crypto (Altcoin) such as Ethereum, USDT, USDC, Ripple and thousand others contribute the rest 51,6% of the total cryptocurrency market cap. This also means that Bitcoin alone contributes almost half of the entire cryptocurrency market value.
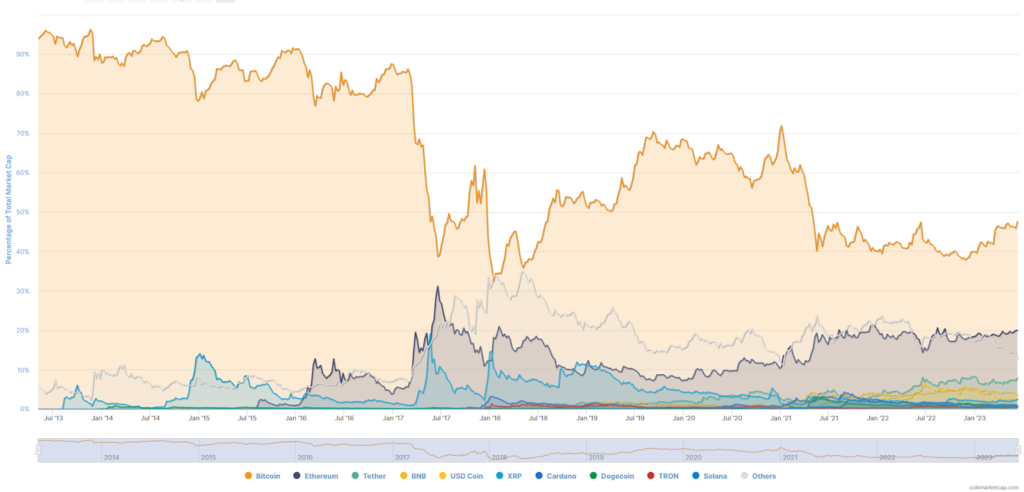
Bitcoin dominance to total crypto market cap over time
Altcoin dominance over crypto market as of June 2023 is 51,6% as follows:
- Ethereum 19,4%
- USD Tether 7,9%
- BNB 3,6%
- USD Coin 2,7%
- Ripple 2,4%
- Cardano 0,9%
- Doge 0,8%
- Tron 0,6%
- Solana 0,5%
- Others 12,8%
Bitcoin’s Dominance Over Time
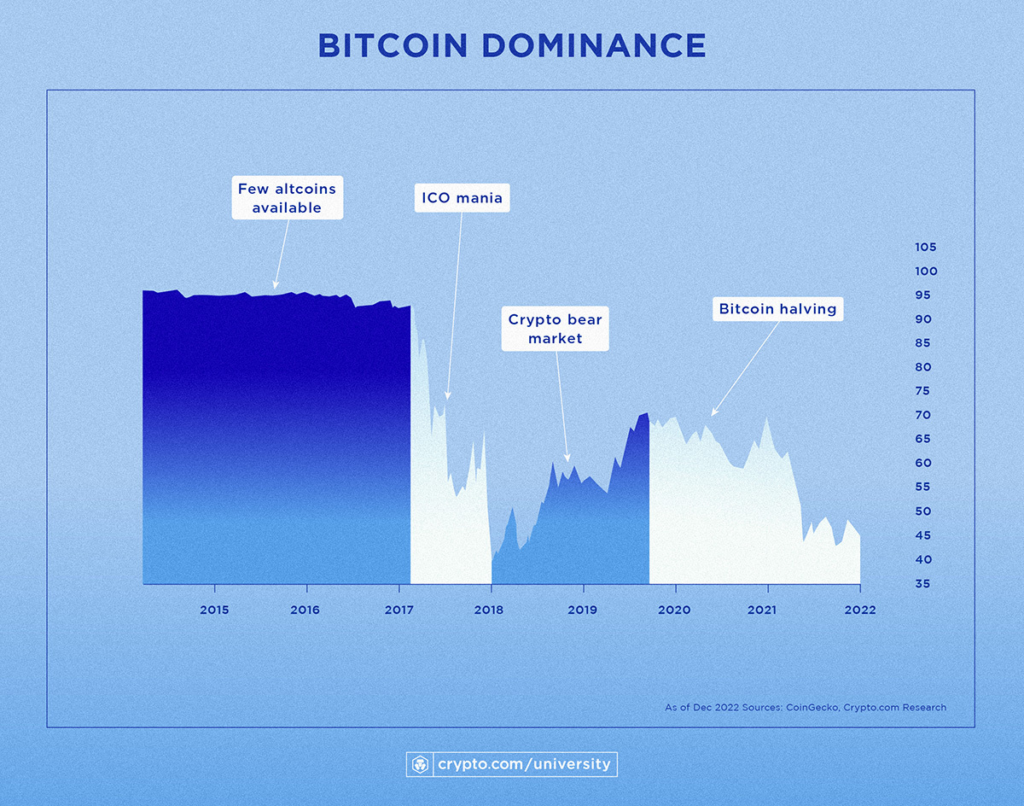
- Before 2017
When Bitcoin mainnet first launched in 2009, it was still the only crypto project in the industry, therefore Bitcoin has 99% – 100% dominance. In 2013, a few altcoin projects began to appear, thus pressing Bitcoin dominance to reach 90% – 94%.
In 2015 other prominent networks were launched, such as Litecoin, Ripple, and Ethereum, this presses Bitcoin dominance lower to 78% – 86%. Since 2015, Bitcoin dominance was never reach 90% anymore
- 2017 – 2018 Dominance
In 2017, many investors were interested in altcoin projects, there were so many ICO offerings, at the time it was called ICO mania. A new blockchain, coin, and token were launched and was offered to investors. However, as the enthusiasm increased, the market speculation regarding altcoins were also high. This phenomena caused Bitcoin dominance to plummet even more, down to 38% – 55%.
However, as the crypto bear market hits 2018, Bitcoin dominance back to its footing by conquering 53% – 60% of the crypto market.
- 2019 – 2020 Dominance
In 2019, Bitcoin dominance stabilized around 55% – 65% as Bitcoin’s price slightly recovered after the 2018 bear market. By the end of 2020, right when the 2021 bull market started, Bitcoin dominance increase to 70%
- 2021 Dominance
In the 2021 bull market, Bitcoin price rose significantly, thus increasing its market cap value higher. However, many altcoin projects that developed since 2018 began to mature, they are also increasing in price and its market cap value is even more significant than Bitcoin. This presses Bitcoin dominance down below 50% although its market cap value is increasing.
What Influences Bitcoin Dominance Fluctuations?
Bitcoin dominance was around 90% back in the day, but why is it far below its value now? Here are some of the key factors that may affect Bitcoin dominance.
- Bitcoin’s price movement
Since the number of Bitcoin in circulation is fairly steady because of its 21 million BTC maximum supply can be mined, the biggest influence on Bitcoin’s market cap is its price. The price itself represents Bitcoin market cap value, in which Bitcoin drop in price, means its market cap and dominance were also dropped, and vice-versa.
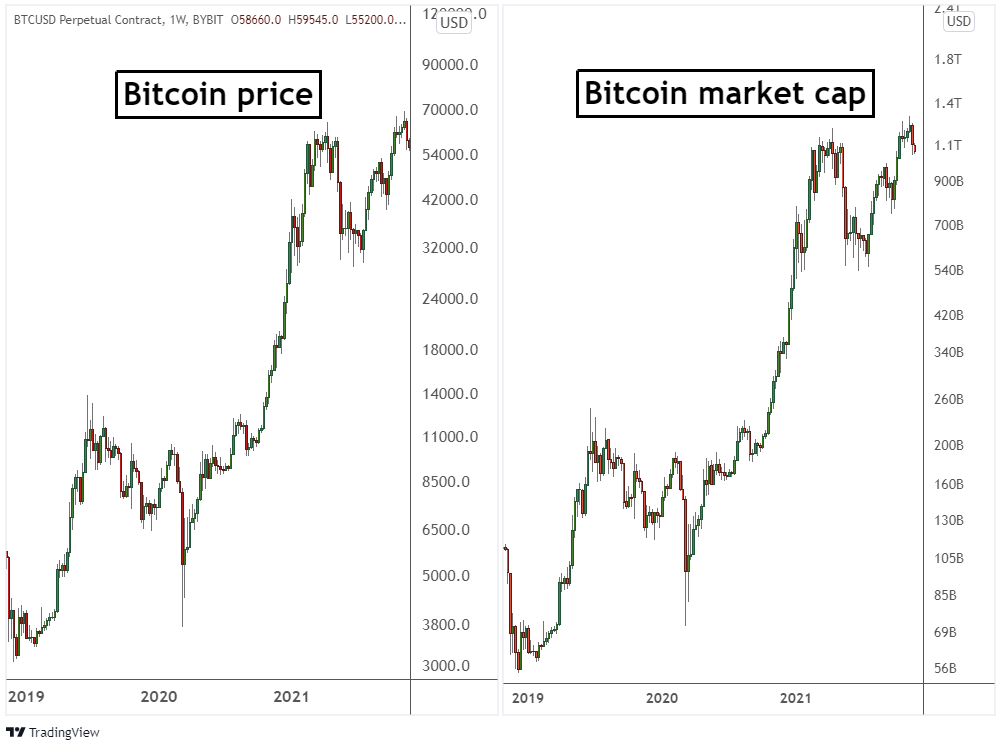
Bitcoin price and its market cap
Take a look at the chart above, it is showing the Bitcoin price with its market cap, as you can see that the market resembles the movement in Bitcoin’s price. However, as Bitcoin’s market cap is rising higher does not mean that Bitcoin dominance is increasing. The second biggest aspect that influences Bitcoin dominance ratio is the altcoin market cap performance.
- Altcoins market cap fluctuations
Altcoin is any other cryptocurrency beside Bitcoin. There are several factors that influence altcoin market fluctuations, such as rising demand of stablecoins and bull altcoin season or known as the alt season.
When it comes to the altcoin market cap, we talk about thousand others of cryptocurrency beside Bitcoin, this means there are a lot of crypto projects that affect the altcoin market cap. For example, the demands of stablecoin altcoin such as USDT, USDC, BUSD may increase during the bear market. Investors tend to hedge their risky assets with more stable assets. This made the USD stablecoins supply to increase as the demands asked, thus increasing the stablecoin altcoin market cap.
The same can be said when the bull market kicks in, back in 2021 there are many altcoin that suprasses Bitcoin peromanace. For example there are two meme coins, Doge and Shiba, both increases in price and its market cap dramatically. These factors also contribute to the altcoin market cap, therefore also affect the Bitcoin market cap and its dominance.
How to Use The Bitcoin Dominance
Here we explain two of the best possible strategies to maximize the Bitcoin dominance indicator in trading.
- Identifying altcoin season
To determine the trend of Bitcoin dominance, first you can use TradingView or Coinmarketcap chart to view the Bitcoin dominance index. Next, compare the dominance ratio to Bitcoin price at the moment.
After that, use this table to measure the altcoin season
| Bitcoin Dominance | Bitcoin Price | Signal |
| In an uptrend | In an uptrend | BUY Bitcoin |
| In an uptrend | In a downtrend | SELL Altcoin |
| In a downtrend | In an uptrend | BUY Altcoin |
| In a downtrend | In an Downtrend | SELL Bitcoin |
Lastly, once the perspective has been established, then you can identify trading opportunities using price action, candlestick patterns and/or other technical indicators.
- Extreme High and Low Bitcoin Dominance Levels
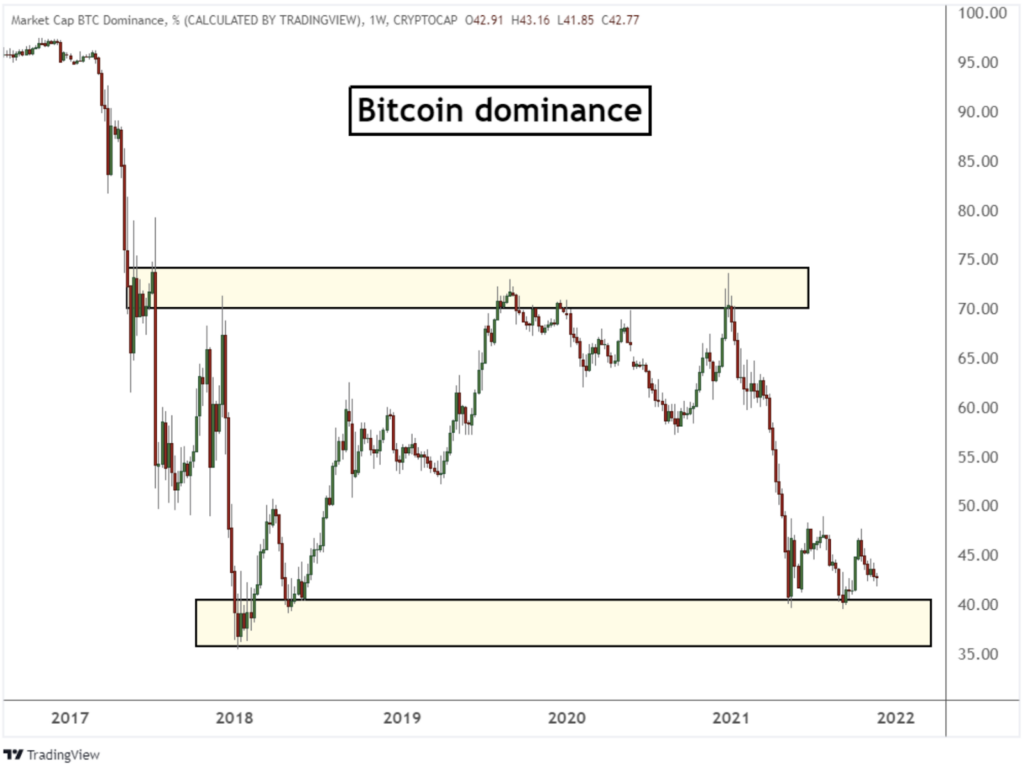
Between 2017 ICO mania and 2021 DeFi Summer, Bitcoin dominance reached a high around 75% and a low around 35%. These two values are regarded as the extreme historical Bitcoin dominance levels.
When Bitcoin dominance moves closer to 75% dominance level, there might be an expectation that BTC price will due a major correction.
On the other hand, when Bitcoin dominance decreases and reaches close to historically 35% low levels, traders can expect an imminent upside movement of Bitcoin price.
Closing
In conclusion, crypto dominance is a significant market indicator especially the Bitcoin dominance or Bitcoin index. It provides insights into crypto market sentiment and aiding in informed decision making investment. However, its interpretation requires understanding of the larger context, including market conditions, altcoin season, and individual investment strategies.
The methods and approaches to analyzing crypto complex price volatility will change as the Bitcoin and other crypto markets evolve and develop even further.
 1
1