Technical analysis is an important element in analyzing cryptocurrencies price movement. The two of the most common terms we will hear when crypto traders talk about crypto price are the ‘support’ and ‘resistance’ levels. The support and resistance levels are often used as two important indicators to predict whether a price of a certain crypto asset or token will rise or fall, given specified price levels. These two terms are practically applicable to every other financial market, such as stocks, forex, commodities, and of course the cryptocurrency assets.
This support and resistance terms concept may easy to understand, however it is difficult to comprehend it entirely, especially when traders wants to embrace its concept to their trading strategies. Interpreting support and resistance levels can be very subjective depending on traders eyes, in fact one trader to another trader may find differences in their analysis.
Here we will cover how to identify and master the support and resistance concept in crypto trading to maximize your trading journey or at least keep you away from the potential risk of losses.
What is Support?
Now imagine you are inside a house, where will you be standing? On the floor right? The floor will be your foothold to keep you above the ground. The support levels in trading terms also works the same, its existence used to hold the price from falling further than specified price range.
The support levels are expected to hold the price from further falls since investors believe there will be buying pressure when the price falls to specified level. When this buying pressure kicks in, according to the supply and demand rules, the prices will be pushed upward.
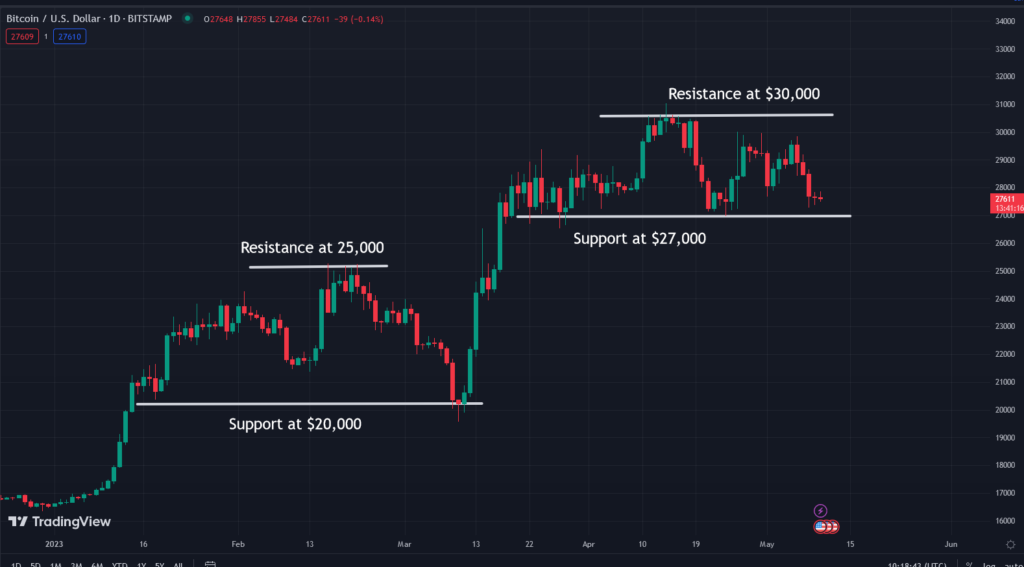
Example of support level in crypto asset:
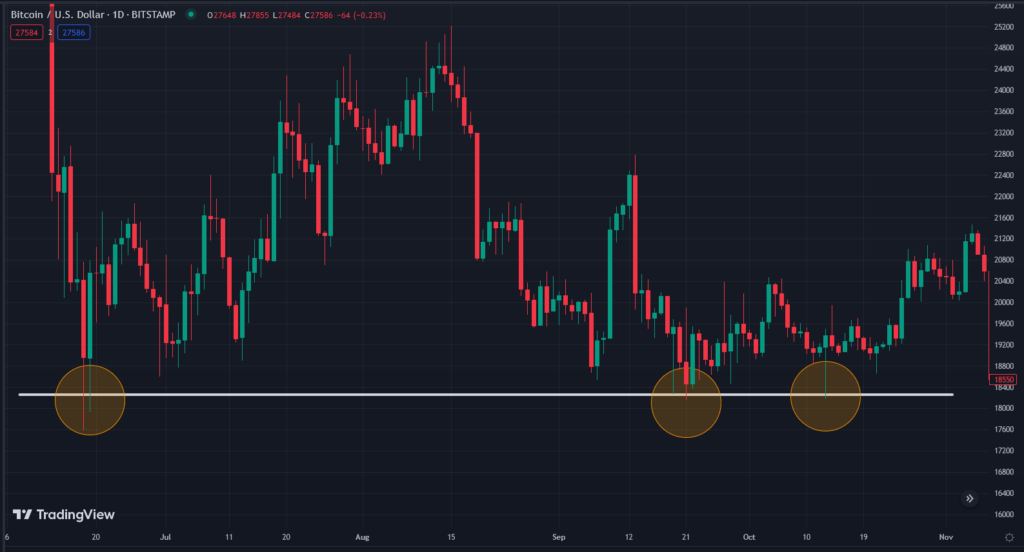
This is how support level works on Bitcoin on June to October 2022, the chart may looks messy to you, but we will explain what happened on this chart
- First, you will notice that the price plunged before the first yellow circle on the bottom left of the chart. It is the crypto bearish price movement during 2022
- Then you will notice the first yellow circle, it is sits around $18,000 per 1 BTC and this level hold BTC price from further downward movement
- After hitting the first support level, BTC price goes up and reach the $24,000 mark before it is retrace back to $18,000 support zone
- Finally the price retest the $18,000 support zone, you can see the second and the third yellow circle where the price falls exactly around the first yellow circle.
- We draw white a straight line around this $18,000 support zone and now you can see the price always bounces upward from this zone, this is what we meant by support level.
What Is Resistance?
In contrast to support, the resistance level is the ceiling or the roof inside a house. When you throw things up into the air, it will hit the house’s ceiling right? That is how the resistance works in trading terms, when the price goes up it will eventually reach the ceiling or the highest point the price can reach before it is due correction downwards.
The resistance levels are expected to keep the price from going up since investors believe there will be selling pressure when the price reaches a certain highs point. When selling pressure enters the market, the crypto prices are expected to be pushed downwards according to supply and demand rules.
Example of resistance level in crypto asset:
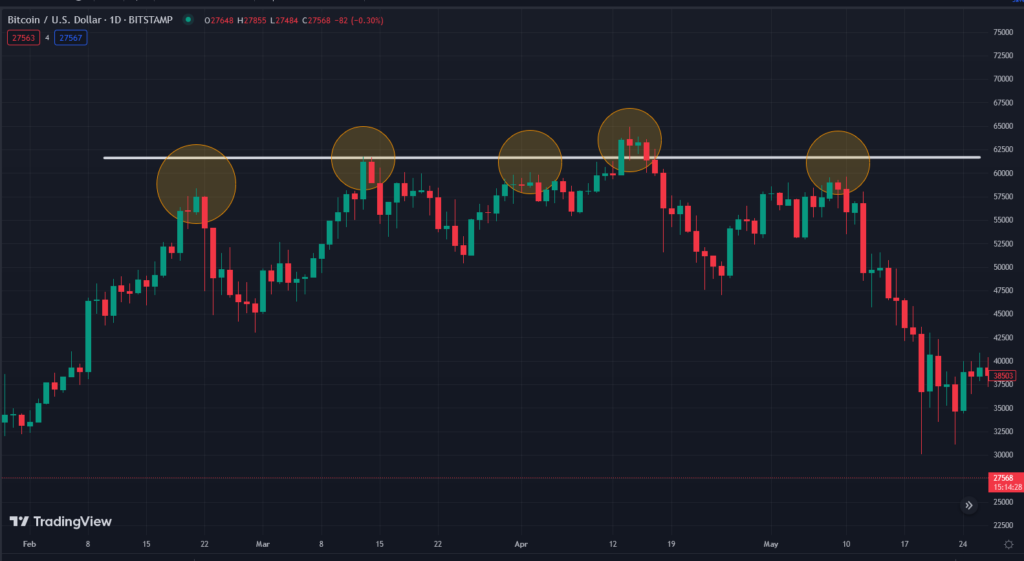
- First, this chart is BTC price movement from February to May 2021 during the bull run, you can see the price goes up before it hits the first yellow circle from the top left of the chart
- Then the price reaches $59,000 per 1 BTC or almost $60,000 on the first yellow circle before it is due minor correction, this $60,000 zone become the resistance level and keep the price from further rising
- The price then hits the 2nd and 3rd yellow circle at the price of $60,000, then hits the 4th yellow circle at the price of $63,000, then hits the 5th yellow circle at the price of $59,000. Here you will understand that the price always bounce down from the $60,000 resistance zone
- We draw a white straight line around this $60,000 resistance zone and now you can see the price always bounces downward from this zone, this is how resistance zone works
Does the price always bounce up and down from support and resistance level? The answer is No, there is always a chance that the price will continue its upward or downward movement while ignoring the previous support or resistance level.
Take a look at this Ethereum price chart:
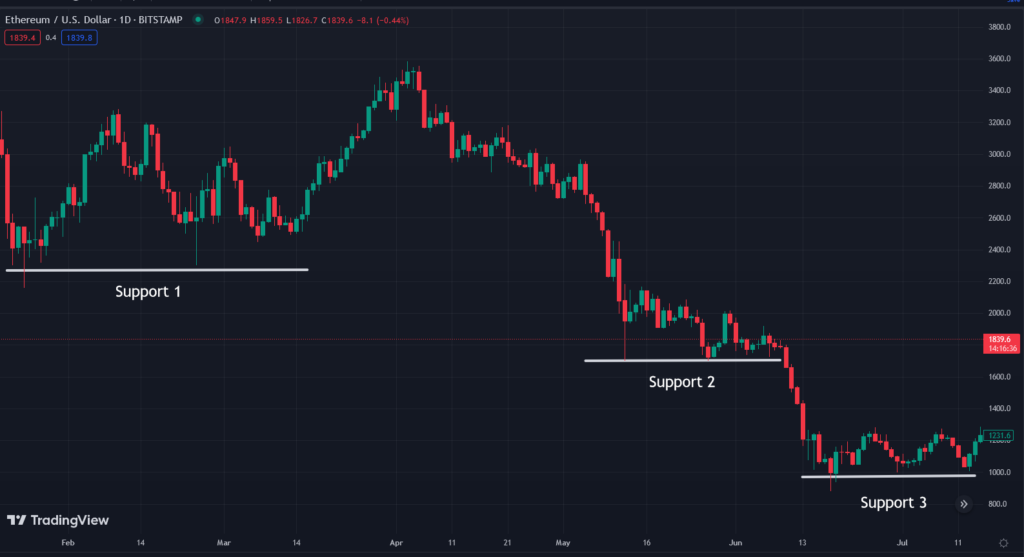
- This ETH chart is taken from January to July 2022
- You can see there are 3 support levels in play on this chart. The first one is Support 1 line on the $2,300 zone, ETH price bounces up two times after hit this support level
- However, in May, the support line broke, and the price fell below to lower support level on Support 2 line around the $1,700 zone. The price the goes up for a while before it continue to fall further
- Now the last support line holding ETH price is on the Support 3 line around the $1,000 price zone, Ethereum price then holds this support and goes up until 2023.
- This means the support zone is very vulnerable during the crypto bearish period. There is no guarantee that the price will always bounce up every time it hits the support levels, traders need to take cautious analysis of support levels during the bearish period.
Similar to support level which vulnerable during the crypto bearish period, the resistance level are also vulnerable during the crypto bull run
Take a look of this Ethereum price chart:
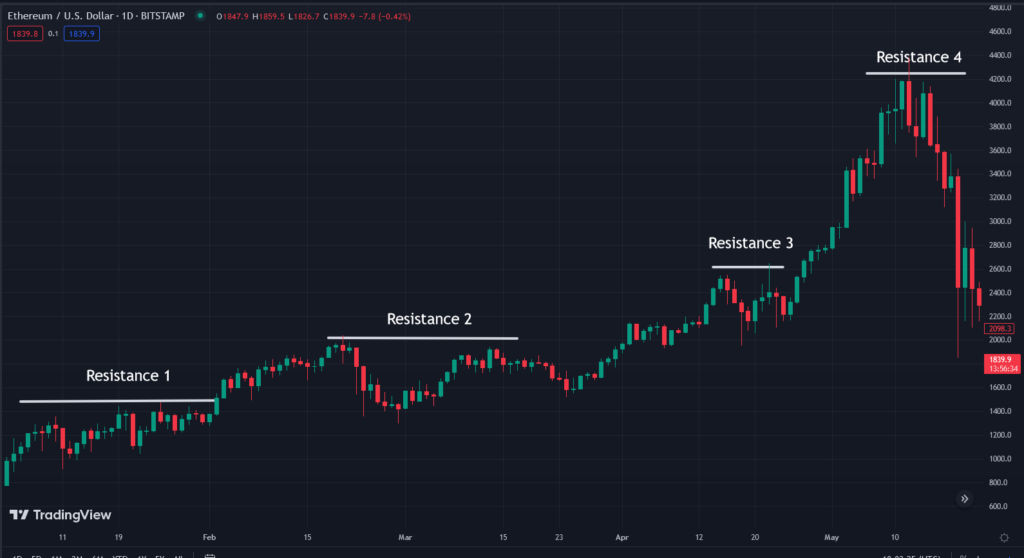
- The chart was taken from January to May 2021 during the crypto bull run, you can notice the upward trend of ETH price
- There are 4 resistance lines in play here, first the Resistance 1 line on the $1,500 price zone. Although the price was not bounce down from this resistance, it hold the price from rising further for a while
- Then the Resistance 1 line broke and the price continued to rise to the Resistance 2 line around the $2,000 price zone before it was due for a correction. Then the price broke the Resistance zone 2 and hits the Resistance 3 zone
- It also broke the Resistance 3 zone and reaches Resistance 4 line on the $4200 price zone before ETH price goes down fo correction
These two Ethereum charts show us the support and resistance level, although it is a very powerful concept for trading, it still may fail given the market changing situations.
Types of Support and Resistance
Support and resistance are leading indicators that investors/traders can draw or set by themselves, although there are also many coded support and resistance indicators that can automatically tell traders where the support and resistance lies.
Here certain methods traders can identify certain support and resistance:
1. Draw a trend line or area line near round numbers
Human behind trading desks love round numbers, they tend to draw support and resistance line around these numbers
2. Use another indicators such as the moving averages
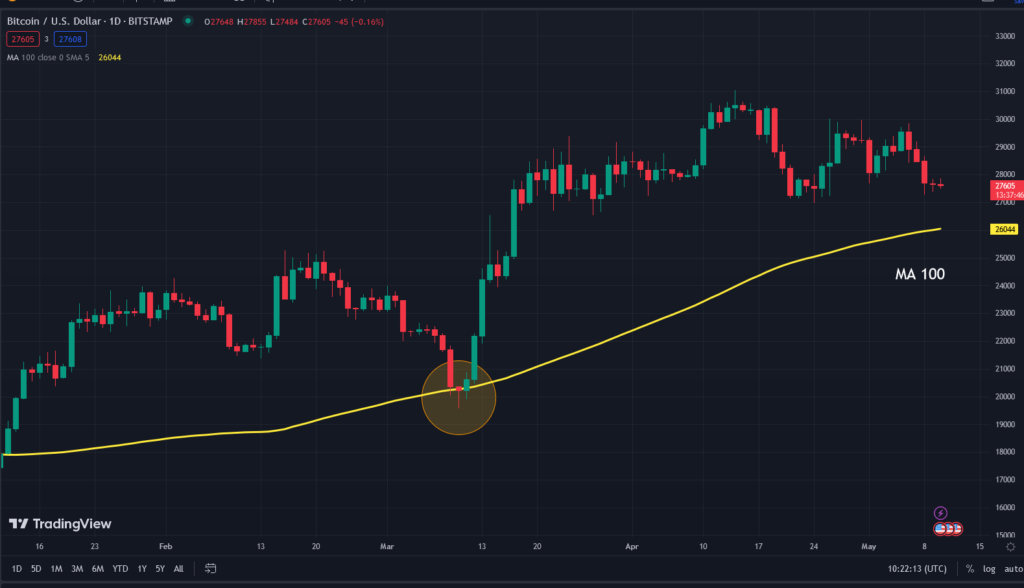
Indicators such as moving averages can also be used as alternative support and resistance zones, this indicators may adapt to the price movements and become dynamic support and resistance lines. There are other indicators that can be used as support and resistance line such as bollinger bands, donchian channel, alligator, etc
3. Using mathematical formulas such as the fibonacci retracement levels
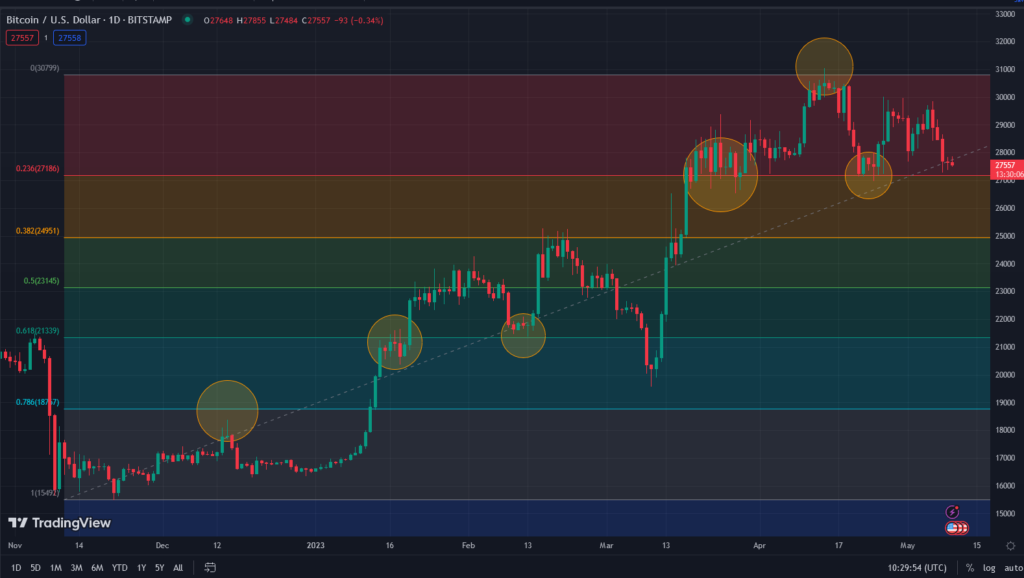
Fibonacci retracement calculator although difficult to master but it can be powerful tool to determine the upcoming support and resistance zone which the price may head to next
How to Use Support and Resistance in Trading
There are several ways to emphasize support and resistance in your trading
1. As entry point
The support and resistance zone can help traders to identify potential buying or selling point for desired crypto assets. Ideally traders will buy when the asset hits a nearby support zone, then sell the assets when it hits the resistance zone.
However, as we mentioned before, there is no absolute support and resistance level, they tend to break during changing market conditions. It is advisable to traders to observe a wider chart perspective on a longer timeframe in order to carefully determine the potential support and resistance levels.
2. As take profit point
The resistance zone can be a perfect take profit point for traders to sell their crypto. However as the crypto space keeps growing it is advisable to hold at least some portion of crypto assets and not sell your whole crypto holding.
3. As stop loss point
When market conditions are different from your analysis or prediction, the support level can be a good point to put some stop loss. You can put your trading stop loss slightly below the nearest support level to avoid the price hitting the support and then going up. For example, when nearest BTC support sits around $20,000, you can put your stop loss around the $19,700 mark to avoid your stop loss triggered when the market is actually moving toward your analysis.
In simple terms, the support line can be used as a buying point while the resistance line can be used as a selling point for trading.
Closing
Any trader can use support and resistance as reference for their trading, however it is important to combine your strategy with another technical analysis technique. As the support and resistance line can easily break due to market conditions. The most accurate support and resistance levels are actually confirmed with multiple strategies which combining the leading and the lagging indicators.
 3
3