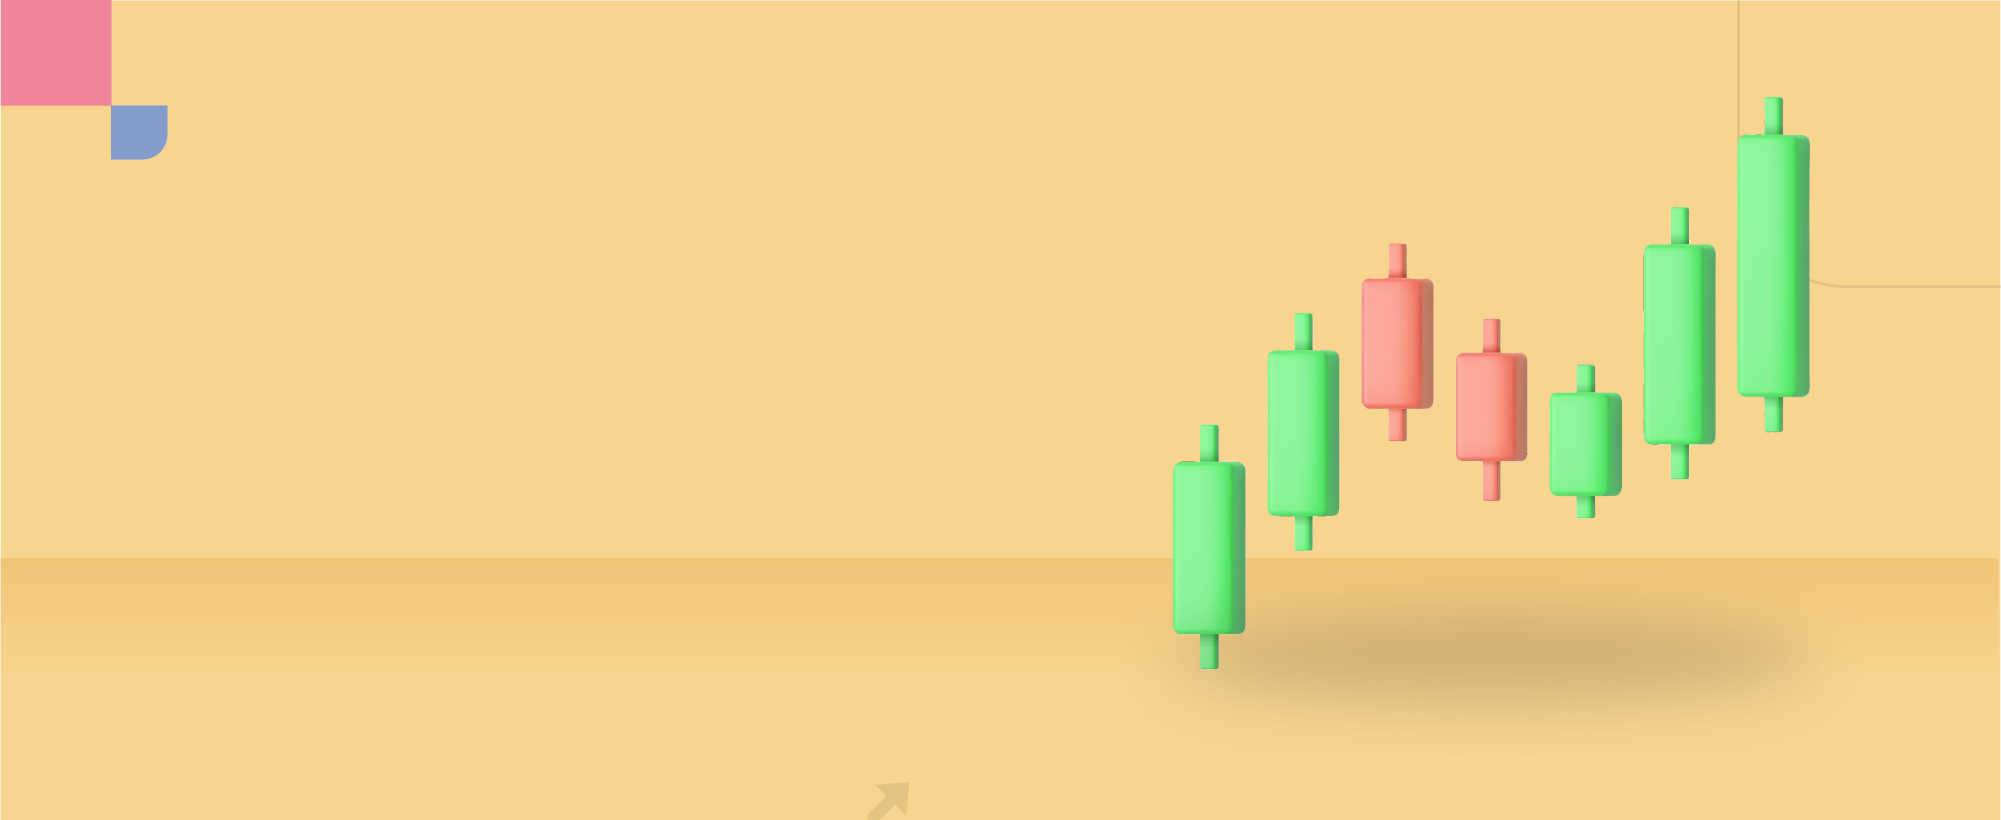
The price changes on financial markets are shown visually by several illustrations such as line graphs and candlestick graphs. The most favorable graphs that are used by many investors are the candlestick chart. It is formed by utilizing candlestick charts to plot an asset’s open, high, low, and closing prices over a specific time period, such as a day, week, or month.
Although many investors observe the candlestick chart most of the time, many investors did not know how to use its advantages on financial markets. Here we explain each of important and common candlestick pattern around the charts.
Using Candlestick Patterns
Candlestick patterns can be used to observe, analyze and forecast specific asset’s price movements and determine the behavior of market participants. Traders can utilize numerous candlestick patterns to detect important price movements on the chart. These can be applied to long-term position trading, swing trading or even short-term day trading. While some candlestick patterns might reveal insights about the balance of buyers and sellers, others might point to a reversal, continuation, or indecision of the price movements.
It is important to remember that candlestick patterns do not always represent a buy or sell signal. Instead, they are visual graphs to examine the market structure and a potential sign of trading opportunities.
Here’s how to read candlestick graphs

-
- Open: The opening price or first recorded trading price of the asset within that particular time frame.
-
- High: The highest recorded trading price of the asset within that particular time frame.
-
- Low: The lowest recorded trading price of the asset within that particular time frame.
-
- Close: The closing price or last recorded trading price of the asset within that particular time frame.
Also note that:
-
- When price goes down, then the close (4) below the open (1)
-
- When price goes up, thet the close (4) above the open (1)
-
- When open (1) and close (4) on the same price or almost identical, the candlestick color turns into white, not green or red
Bullish Candlestick Patterns
1. Hammer
Hammer is a single candlestick pattern that has a small body and a long lower wick. It suggests that sellers pushed prices down during the trading session, but buyers were able to push prices back up to close near the opening price. The hammer pattern indicates a potential trend reversal and is typically seen at the bottom of a downtrend.

2. Bullish engulfing
A bullish engulfing pattern is a two-candlestick pattern where the second candlestick completely engulfs the first candlestick. The first candlestick is a bearish candlestick, and the second candlestick is a bullish candlestick. The pattern indicates that buyers have taken control of the market, and a trend reversal may occur.

3. Morning star
A morning star is a set of three candlesticks that indicates a potential trend reversal. The first candlestick is a long bearish candlestick, the second candlestick is a small-bodied candlestick that can be bullish or bearish, and the third candlestick is a long bullish candlestick that closes above the midpoint of the first candlestick.

4. Three white soldiers
Three white soldiers pattern is three bullish candlesticks that open within the body of the previous candlestick and close at higher level than the previous candle’s high.

5. Bullish harami
The bullish harami is a two-candlestick pattern that indicates a potential trend reversal. The first candlestick is a long bearish candlestick, and the second candlestick is a small-bodied bullish candlestick that is completely contained within the body of the first candlestick.

6. Inverted hammer
The inverted hammer is a single candlestick pattern that has a small body and a long upper shadow. It indicates that buyers were able to push prices up during the trading session, but sellers were able to push prices back down to close near the opening price. The inverted hammer pattern suggests a potential trend reversal and is typically seen at the bottom of a downtrend.

Bearish Candlestick Patterns
1 . Shooting star
A shooting star is a single candlestick pattern that has a small body and a long upper shadow. It indicates that buyers pushed prices up during the trading session, but sellers were able to push prices back down to close near the opening price. The shooting star pattern suggests a potential trend reversal and is typically seen at the top of an uptrend.

2 . Bearish harami
The bearish harami is a two-candlestick pattern that indicates a potential trend reversal. The first candlestick is a long bullish candlestick, and the second candlestick is a small-bodied bearish candlestick that is completely contained within the body of the first candlestick.

3. Three black crows
Three black crows pattern is three bearish candlesticks that open within the body of the previous candlestick and close below than the previous candle’s high.

4. Evening star
The evening star is a three-candlestick pattern that indicates a potential trend reversal. The first candlestick is a long bullish candlestick, the second candlestick is a small-bodied candlestick that can be bullish or bearish and gaps higher, and the third candlestick is a long bearish candlestick that closes below the midpoint of the first candlestick. The pattern suggests that buyers have lost control, and sellers are taking over the market.

5. Bearish engulfing
The bearish engulfing pattern is a two-candlestick pattern where the second candlestick completely engulfs the first candlestick. The first candlestick is a bullish candlestick, and the second candlestick is a bearish candlestick.

6. Hanging man
The hanging man is a single candlestick pattern that has a small body and a long lower wick. It indicates that buyers were able to push prices up during the trading session, but sellers were able to push prices back down to close near the opening price. The hanging man pattern suggests a potential trend reversal and is typically seen at the top of an uptrend.

Continuation patterns (Doji)
When the open and close are at the same or very near to each other, a Doji is formed. The price may rise or fall above the opening price but ultimately closes near or same at the open. A Doji may therefore represent a point of uncertainty between buying and selling pressure. However, the interpretation of a Doji is highly dependent on context or the price movement before it
A Doji can be characterized in one of several ways depending on where the open/close price:
1. Four price doji or Neutral doji
A neutral doji occurs when the opening price and the closing price are almost identical, resulting in a small or non-existent body. The doji can appear with either a long or short shadow, indicating that the market was evenly balanced between buyers and sellers.

2. Long-legged doji
A long-legged doji occurs when the opening price and the closing price are almost identical, and the high and low prices of the trading period are far apart. This results in a long shadow on both ends of the doji. The pattern indicates a high level of indecision in the market and suggests that traders are unsure about the direction of the price.

3. Dragonfly doji
A dragonfly doji occurs when the opening price and the closing price are almost identical, and the low price of the trading period is far below the opening and closing prices. This results in a long lower shadow and no upper shadow. The pattern indicates that sellers were initially in control of the market, but buyers stepped in and pushed the price back up to close near the opening price.

4. Gravestone doji
A gravestone doji occurs when the opening price and the closing price are almost identical, and the high price of the trading period is far above the opening and closing prices. This results in a long upper shadow and no lower shadow. The pattern indicates that buyers were initially in control of the market, but sellers stepped in and pushed the price back down to close near the opening price.

Even if a trader does not use candlestick patterns in their trading strategies, it is essential that traders or investors at least understand or memorize some of them.
Final Conclusion
Candlestick patterns are a powerful tool for traders to analyze price movement. By learning to spot and interpret the various candlestick patterns, traders and investors can gain a deeper understanding of market sentiment and potentially increase their profits. However, it’s important to keep in mind that candlestick patterns are not a perfect tool of their own and should be used in combination with another technical and fundamental analysis tools.